Introduction to Trading View and Its Core Features
In today’s fast-paced financial markets, access to reliable, comprehensive, and user-friendly charting tools is essential for traders and investors alike. Among the plethora of platforms available, trading view has emerged as a leading solution, offering a blend of advanced technical analysis, social interaction, and seamless integration across multiple asset classes. Its reputation as a “super-charting” platform is built on a foundation of powerful tools, customizable interfaces, and vibrant community engagement, making it a preferred choice for market enthusiasts worldwide.
Understanding the Trading View Platform
Trading View is a versatile online platform designed for real-time chart analysis, market monitoring, and social collaboration. It caters to traders, investors, and analysts by providing a centralized space where they can observe live market data, develop trading strategies, and share insights. Unlike traditional trading software limited to specific brokerages, Trading View’s cloud-based architecture allows access via web browsers and mobile apps, ensuring users can stay connected from anywhere at any time.
The platform spans all major markets including stocks, cryptocurrencies, forex, commodities, and indices. Its highly intuitive interface features a highly customizable workspace, enabling users to tailor their environment for efficiency and clarity. Integration with various brokerage accounts allows traders to execute orders directly from the platform, streamlining workflows and reducing delays.
To explore the extensive capabilities of Trading View, visit their official website here.
Key Tools for Traders and Investors
Advanced Charting Tools
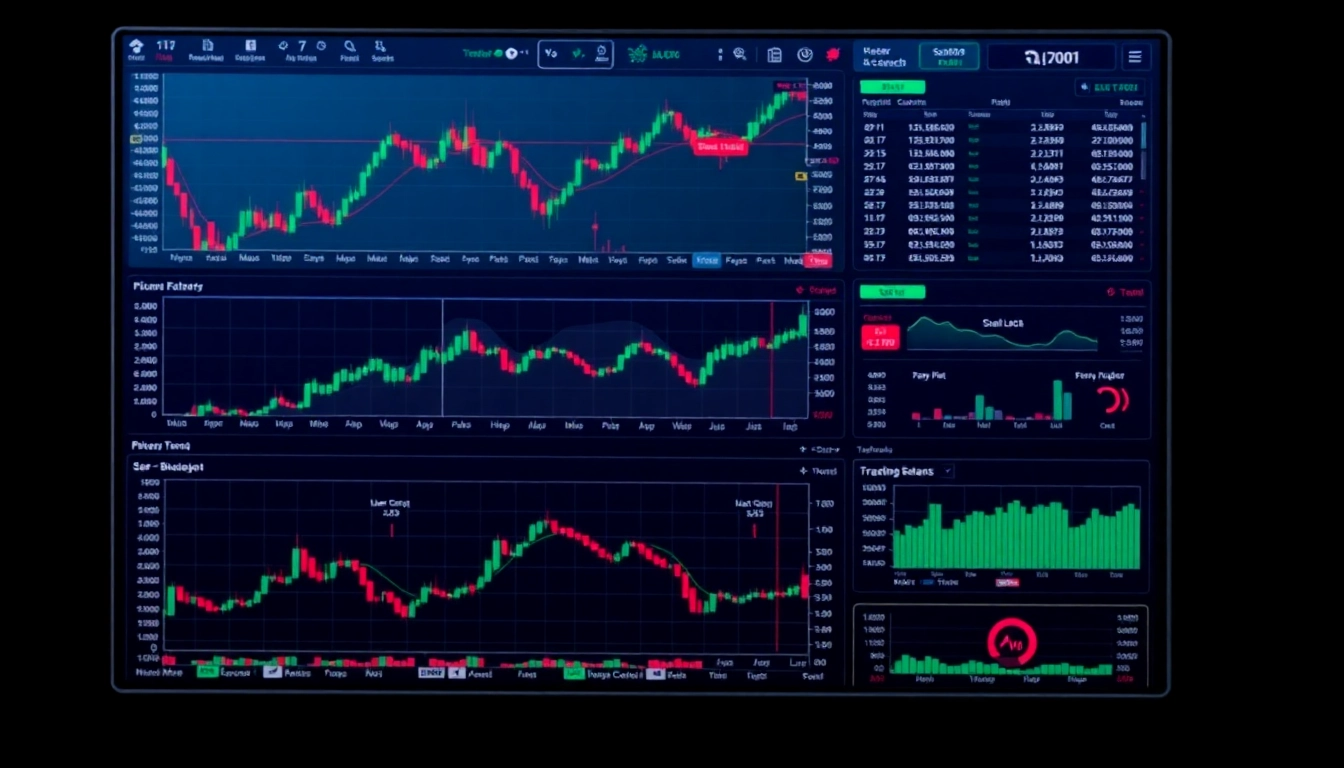
At the core of Trading View are its sophisticated charting tools. Users can access a wide array of chart types — including line, bar, candlestick, and Heikin Ashi — with the ability to overlay multiple asset symbols for comparative analysis. The platform also offers a rich catalog of technical indicators such as moving averages, RSI, MACD, Bollinger Bands, and custom scripts that can be tailored to specific trading strategies.
Drawing and Annotation Features
Drawing tools enable precise analysis of market trends. Traders can draw trendlines, channels, Fibonacci retracements, and geometric shapes directly on the charts. These annotations assist in identifying support and resistance levels, trend reversals, and potential breakout zones, enhancing decision-making accuracy.
Real-Time Data & Alerts
Real-time data feeds ensure traders stay updated with current market movements. Alerts can be set based on price levels, indicator crossovers, or custom conditions, triggering notifications via email, SMS, or platform alerts. This proactive approach helps traders capitalize on opportunities without constantly monitoring markets manually.
Social and Community Features
Another defining aspect of Trading View is its active community. Traders can publish ideas, share charts, and discuss market trends. This social aspect fosters collective learning, crowd-sourced insights, and validation of trading hypotheses, enriching individual analysis with diverse perspectives.
Benefits of using Trading View for Market Analysis
Trading View offers a host of advantages that elevate market analysis from basic chart viewing to strategic trading. Its cloud infrastructure ensures easy access across devices, eliminating the need for software installations. The platform supports collaborative analysis, making it suitable for teams and trading communities.
Customization is another hallmark, allowing users to configure dashboards, indicators, and layouts to suit their unique trading styles. The integration with brokerage accounts streamlines order execution, saving valuable time in fast-moving markets. Additionally, the community-driven approach provides real-world insights and real-time feedback, amplifying the trader’s analytical depth.
By combining technical tools with social interaction, Trading View transforms market analysis into an engaging, dynamic process, empowering traders to make informed decisions grounded in data and shared expertise.
How to Set Up Your Trading View Account for Success
Creating an Effective Watchlist and Alerts
Start by establishing a tailored watchlist containing assets relevant to your trading strategy. Use the platform’s intuitive interface to add stocks, cryptocurrencies, or forex pairs, and organize them into categories for quick access. Setting up alerts for price levels, indicator signals, or pattern formations ensures you never miss critical movements, especially during volatile periods.
Customizing Charts and Technical Indicators
Personalize your charts with preferred indicators and techniques. Save chart templates for repetitive analysis, and apply multiple indicator overlays to identify confluences. Experiment with different timeframes—from minutes to monthly charts—to develop a comprehensive understanding of asset behavior across scales. Also, explore community scripts and custom indicators available through Trading View’s Public Library to expand analytical tools.
Integrating Trading View with Other Trading Tools
Enhance your workflow by connecting Trading View to brokerage accounts, risk management tools, and automation scripts. Many brokers support direct integration, allowing seamless order execution without switching platforms. Additionally, APIs and third-party services can be linked for data analysis, portfolio tracking, or automated trading algorithms, making your overall strategy more cohesive and efficient.
Advanced Charting Techniques Using Trading View
Utilizing Drawing Tools and Trendlines
Effective technical analysis hinges on accurate trend identification. Use drawing tools to mark trendlines, channels, and Fibonacci retracements. These help visualize support and resistance zones, identify breakout points, and confirm trend directions. Practice drawing multiple trendlines to recognize complex chart patterns like wedges, flags, and pennants.
Implementing Multiple Time Frame Analysis
To improve trade precision, analyze charts across different timeframes. For instance, identify a long-term trend on monthly charts, then refine entry timing using daily or hourly charts. Trading View allows synchronized multi-chart layouts to facilitate this approach, enabling traders to spot confirmations or divergences across scales.
Applying Scripts and Custom Indicators
Leverage Trading View’s scripting language, Pine Script, to develop personalized indicators or automate strategies. You can use existing scripts from the Public Library or code your own. Custom scripts can help detect specific patterns, generate alerts, or streamline analysis, providing a competitive edge in decision-making.
Strategies for Effective Market Analysis with Trading View
Identifying Trading Setups and Signals
Consistent analysis involves recognizing proven setups such as breakouts, pullbacks, or reversals. Combining multiple technical signals—like candlestick patterns with volume spikes or indicator crossovers—enhances confidence in trade entries. Trading View’s alert system ensures you’re notified when these conditions occur, enabling timely action.
Analyzing Different Asset Classes
Diversification across asset classes benefits from tailored analytical techniques. For stocks, fundamental data can be integrated with technical analysis for holistic insights. Cryptocurrencies require understanding unique market behaviors like high volatility and 24/7 trading, which Trading View efficiently visualizes with real-time data. Forex analysis benefits from liquidity and macroeconomic factors displayed through overlays and news feeds.
Incorporating Fundamental Data
While Trading View specializes in technical analysis, integrating fundamental data—such as earnings reports, economic indicators, or news—can improve decision accuracy. Some assets offer fundamental dashboards, and the platform’s social features often include market sentiment discussions that reflect macroeconomic influences.
Measuring Performance and Optimizing Your Trading View Workflow
Tracking Your Trades and Backtesting Strategies
To refine trading skills, keep detailed records of your trades within Trading View or through external tools. Backtesting strategies on historical data allows validation of hypotheses before live deployment. Use the platform’s charting environment to simulate trades, analyze past performance, and identify areas for improvement.
Using Alerts to Automate Decision-Making
Automation is a key efficiency booster. Set specific alerts based on technical conditions, and combine these with third-party automation tools or API connections to initiate trades. This reduces emotional biases and ensures swift responses to market changes.
Regularly Updating Analysis Techniques
Market dynamics evolve continuously. Regularly review and update your analytical tools, indicator parameters, and strategies. Engage with community ideas, study new scripts, and stay informed on market developments to keep your analysis sharp and relevant.